A new series about Machine Learning (ML) and Image Processing with ImageJ. First we need to create a dataset suitable for machine learning...
1. The problem
The image of Fig. 1 is composed of three different shapes: (i) circles, (ii) squares, and (iii) triangles of various sizes and orientations. Here, we would like to count them. |
| Fig.1: Image containing circles, squares, and triangles of various sizes and orientations. |
Analyze > Analyze Particles...2. Using Analyze Particles
By choosing specific ranges ofCircularity in the Analyze > Analyze Particles... dialog window, it is possible — but not easy — to select one type of objects and count them by reading the number of lines in the table.For example, if you select
0.87-1.0 as circularity, you only select the circles as shown in Fig. 2.However, you need several tries before choosing the good parameters. |
| Fig.2: Selection of the 78 circles (in white) by selecting a range of circularity in Analyze Particles... |
3. Using your brain :-D
Rather than trying again and again to find - by chance - the correct setup for counting the triangles, squares, and circles. It is much more efficient to compute the histogram of the Circularity.You can do that in the Results window. In the menubar, select
Results, then Distribution (Fig. 3) and ... |
| Fig.3: Compute a distribution (histogram) from the Results Table. |
... a new dialog window is displayed (Fig.4).
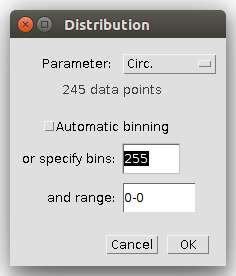 |
| Fig.4: Dialog Window to compute Distribution from the Results table. |
Select as parameter, the circularity (
Circ.), uncheck Automatic binning and type 255 in the field specify bins: (200 is good, too) and click on the OK button.Note: If you don't see theCirc.parameter in the combo, it is possible that you don't measure it during theAnalyze Particles.... Go toAnalyze > Set Measurementsand checkShape Descriptors, then rerun theAnalyze Particles..., new columns will be added in the Results table.
Here, we go!!! ...and a very interesting histogram is displayed (Fig. 5).
The histogram of the circularity shows four separated peaks. By moving your mouse on the histogram, you can read the circularity values. Thus, it is easy to get the min and max values of circularity for the various shapes.
Note: Why four peaks? because there are two types of triangles in the image and they have different circularity values.
 |
| Fig.5: Circularity Distribution with 255 bins. Four classes of objects are easily seen. |
If you have dozen of images like that, you have to find a way to automatically count the number of shapes...Machine Learning (ML) is one of the solution because it groups many algorithms that can help us for this kind of task.
<< Previous: TOC Next: Features >>
4. Other crazybiocomputing posts
Further readings are available in ...
- Machine Learning Glossary
- Machine Learning in ImageJ Series [Link]
- JavaScript/ECMAScript TOC [Link]
No comments:
Post a Comment